Monitoring ClickHouse on Kubernetes
Now that you have your first ClickHouse instance on Kubernetes and are starting to use it, you need to monitoring and observing what happens on it is an important task to achieve stability. There are many ways:
- Built-in dashboard
- Export metrics to Prometheus and visualize them with Grafana
- ClickHouse Monitoring UI that relies on powerful system tables
1. Built-in advanced observability dashboard
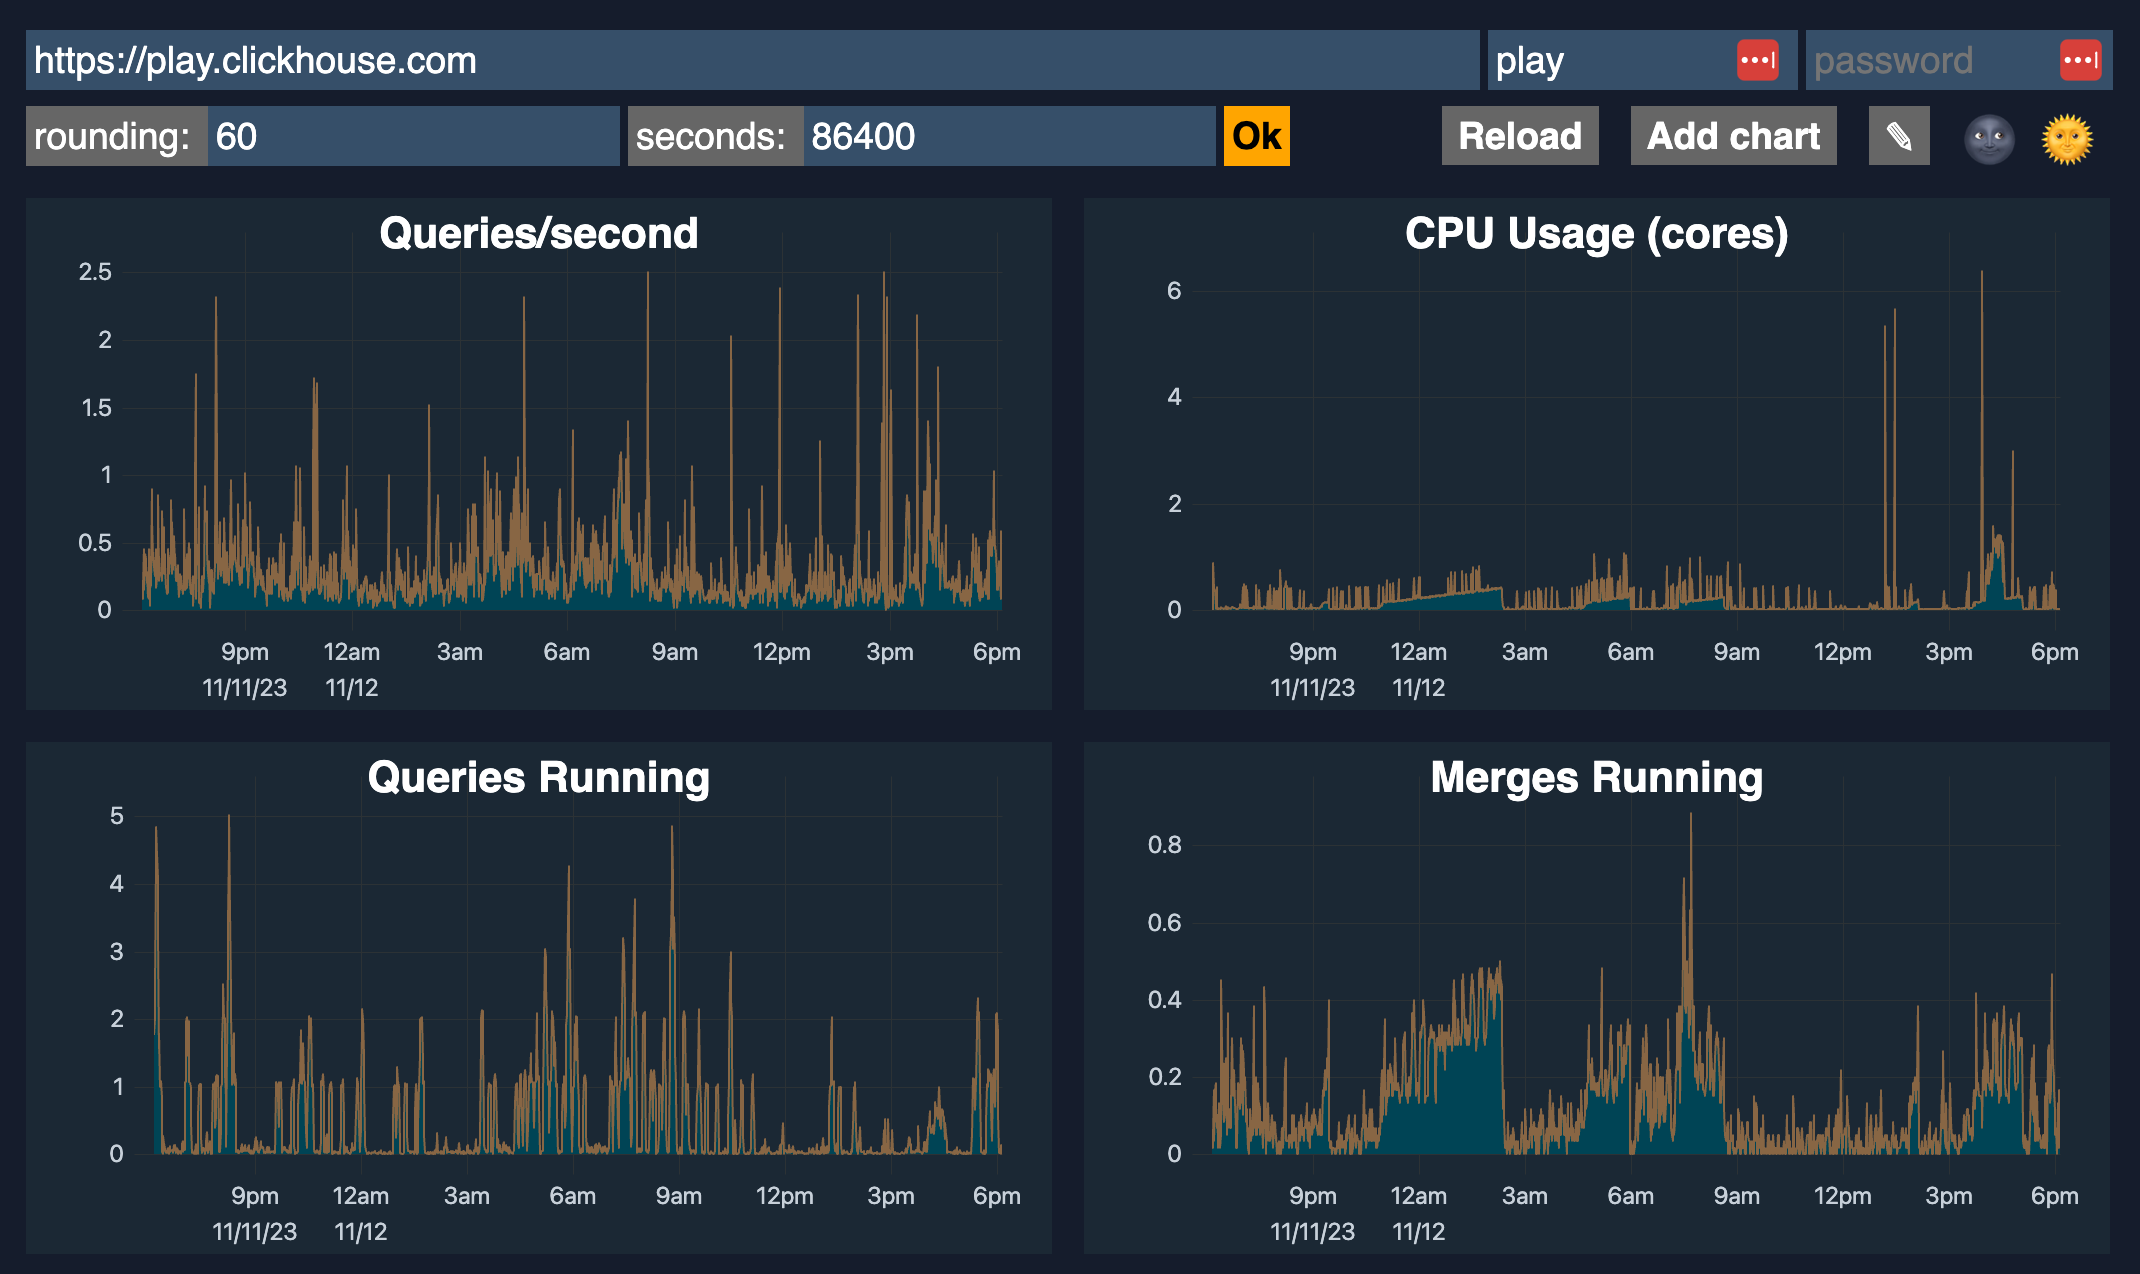
ClickHouse includes an advanced observability dashboard feature accessible at $HOST:$PORT/dashboard (login required).
It displays metrics such as Queries/second, CPU usage, Queries running, Merges running, Selected bytes/second, IO wait, CPU, Read/Write, Inserted rows/second, Total MergeTree parts, and Max parts for partition, etc.
2. Monitoring with Prometheus + Grafana
You can configure ClickHouse to export metrics to Prometheus. ClickHouse Operator do have a section for this:
- Step 1: Setup Prometheus pool data from ClickHouse into Prometheus
- Step 2: Setup Grafana
They also have a dashboard for ClickHouse Operator Dashboard so you can just need to import it:
- Altinity_ClickHouse_Operator_dashboard.json
- ClickHouse_Queries_dashboard.json
- ClickHouseKeeper_dashboard.json
References:
- ClickHouse Grafana plugin 4.0 - Leveling up SQL Observability
- A Story of Open-source GitHub Activity using ClickHouse + Grafana
- Video: Visualizing ClickHouse Data with Grafana
- Visualizing Data with ClickHouse - Part 1 - Grafana
3. ClickHouse system tables
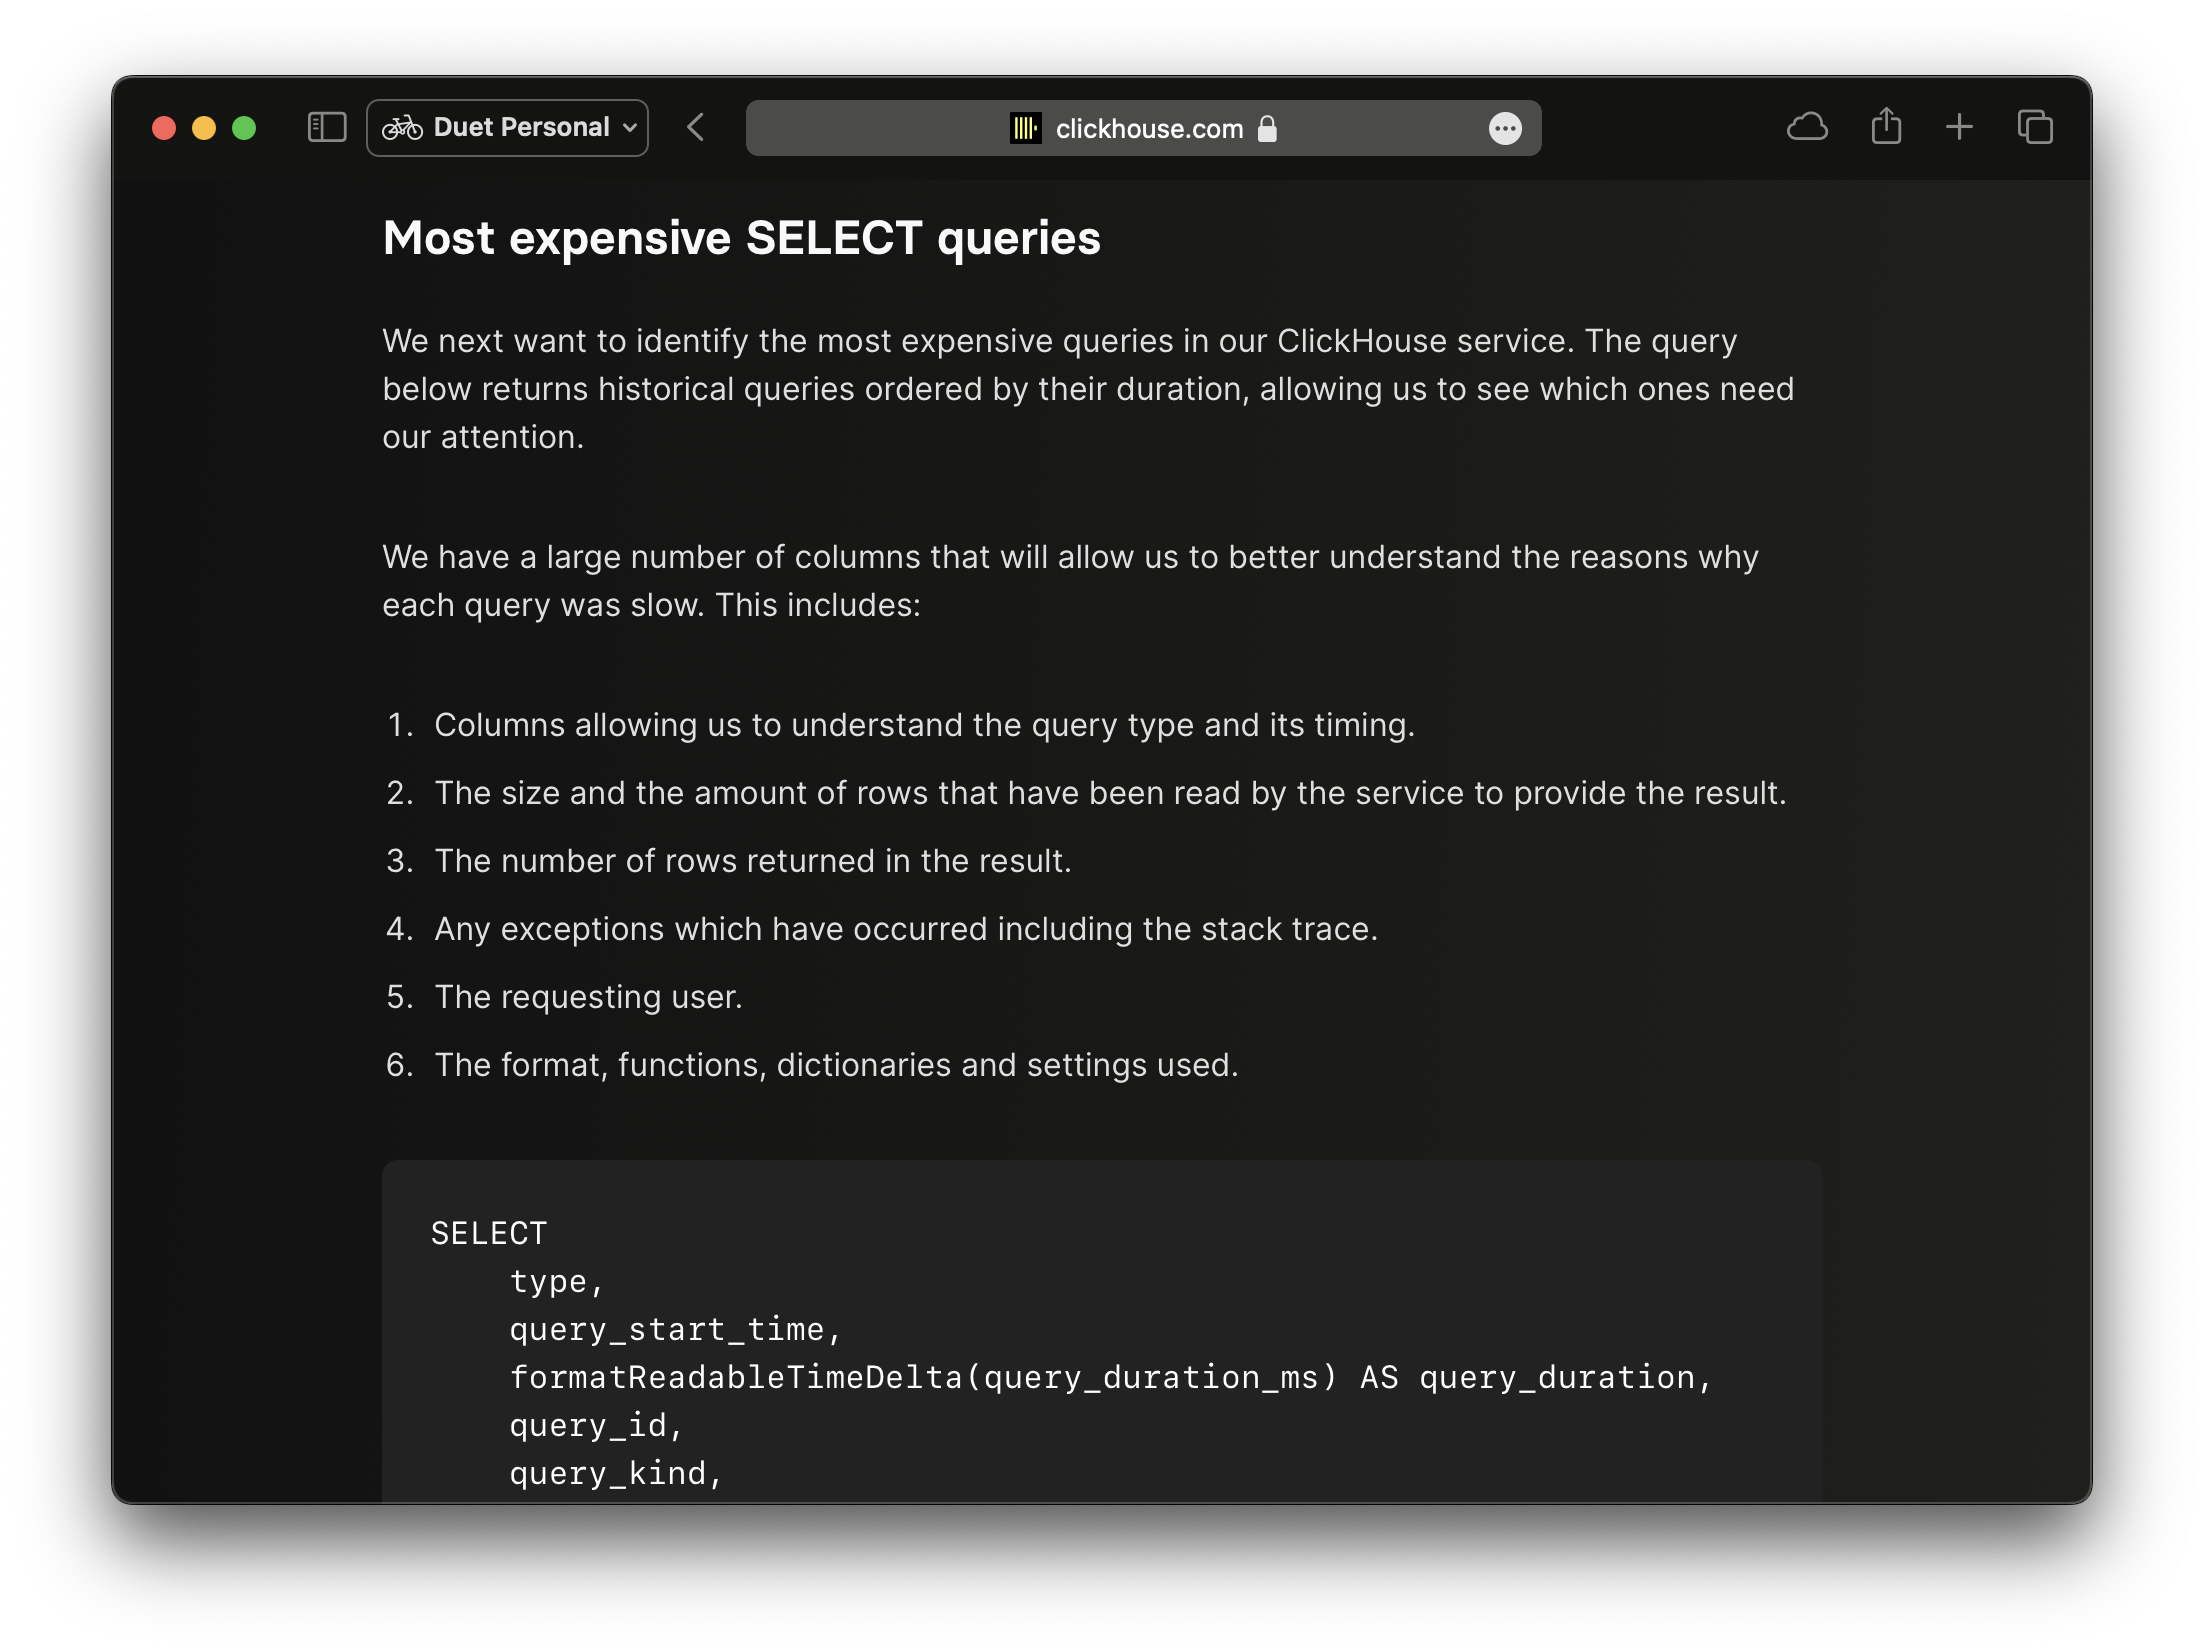
You should read these blog post by ClickHouse about rely on the system tables to get more insights about running queries and their performance. These contains about some topic like for example: most expensive SELECT queries, average query duration and number of requests, number of SQL queries by client or user, etc.
- Essential Monitoring Queries - part 1 - INSERT Queries
- Essential Monitoring Queries - part 2 - SELECT Queries
4. ClickHouse Monitoring UI Dashboard
This is my simple monitoring dashboard for ClickHouse, built with Next.js for monitoring all my clusters. It relies on system tables above that provide rich information. A live demo is available at: https://clickhouse-monitoring.vercel.app/


You can install it into Kubernetes via the latest helm chart here: https://github.com/duyet/charts/tree/master/clickhouse-monitoring
helm repo add duyet https://duyet.github.io/charts

cat <<EOF >> values.yaml
env:
  - name: CLICKHOUSE_HOST
    value: http://clickhouse-single.clickhouse.svc:8123
  - name: CLICKHOUSE_USER
    value: monitoring
  - name: CLICKHOUSE_PASSWORD
    value: ''
EOF

helm install -f values.yaml clickhouse-monitoring-release duyet/clickhouse-monitoring